X
CLient Portal


.svg.webp)

When strikes on Iran killed the country's Supreme Leader on Feb. 28, 2026, and Tehran responded by choking off the Strait of Hormuz, a lot of smart people assumed oil was headed for a permanently higher plateau. A route carrying roughly a fifth of the world's oil and gas supply, closed by a shooting war. What could possibly reverse that quickly?
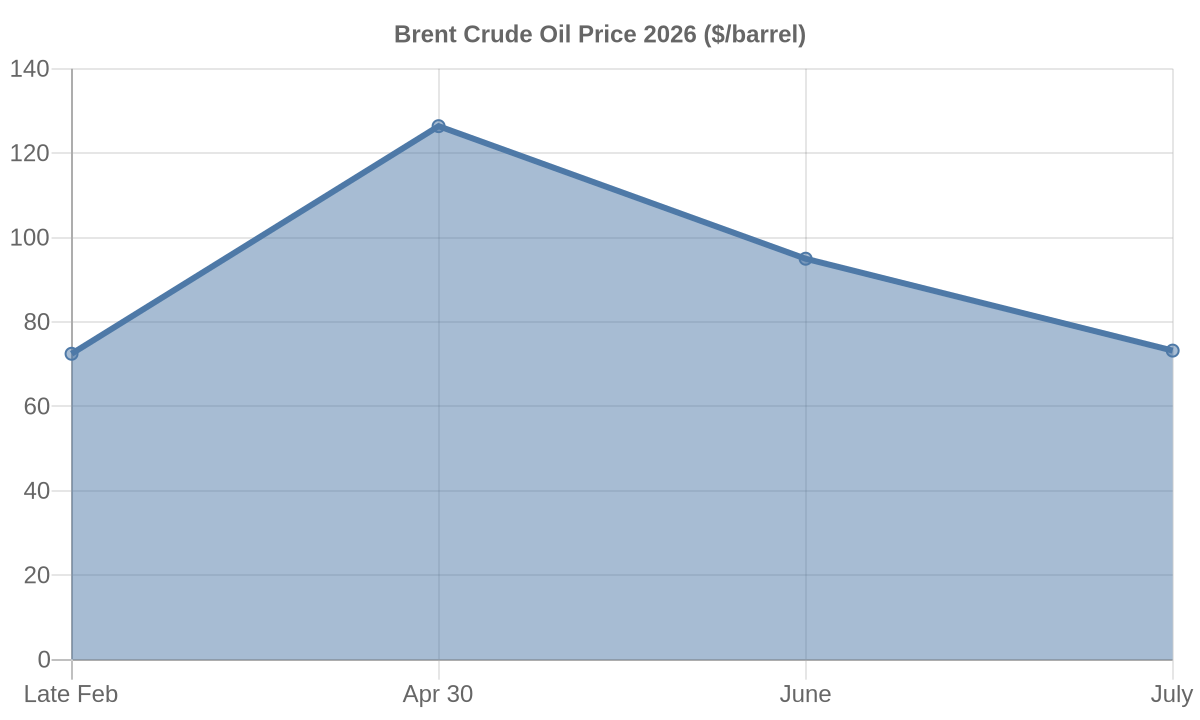
Brent crude price swings during 2026 U.S.-Iran war and peace process, per Reuters/FT/BBC.
As it turns out, quite a lot.
Brent crude, sitting around $72 to $73 a barrel just before the strikes, rocketed to $119 to $120 within a month, one of the largest monthly moves on record. By April 30, it briefly touched $126.41, a four year high and roughly double its pre war level. U.S. crude (WTI) moved in lockstep, up about 90% over the same stretch. Headline inflation readings in the U.S. and Europe jumped as gasoline and utility bills followed crude higher, and central bankers spent March and April fielding questions about a new inflationary era. Market based inflation expectations, the five year breakeven rates investors use to price future price growth, climbed right along with the barrel price.
Then the diplomacy caught up with the panic. A Pakistan mediated ceasefire in early April reopened Hormuz, and by mid June the two sides had signed a 14 point memorandum in Islamabad extending a 60 day truce, lifting the naval blockade, and sketching a path toward sanctions relief. A formal peace framework followed, with a signing ceremony planned in Switzerland. Oil noticed immediately. By June, Brent had fallen to around $95, a correction of roughly 25% from its peak. By July, it had dropped further still, briefly dipping below $72.48, its pre war level, before settling in the low $70s, a retreat of around 40% from the April high.
What gives? The answer is the same one that's applied to nearly every energy shock rooted in geopolitics rather than actual depleted supply: prices spike on fear of what might happen to flows, then fall back once flows actually resume. Core inflation, the reading that strips out food and energy, moved far less than headline CPI throughout the episode, which is exactly what you'd expect if the shock was an external, energy driven event rather than something baked into the broader economy. As energy CPI components eased with the oil retreat, several forecasters who had bumped up their 2026 inflation projections in the spring walked those numbers back down again over the summer.
The pattern has precedent. During the 1973 to 74 Arab oil embargo, prices rose nearly 300% and the effects lingered for years, feeding genuine stagflation. But most geopolitical oil shocks since then have looked more like 2026. The 1990 to 91 Gulf War pushed oil above $40 a barrel before falling sharply once coalition forces secured supply. The run up to the 2003 Iraq War lifted crude toward $35 to $40, only to reverse as the war's actual scope became clear. Even the 2019 tanker attacks near Hormuz produced a brief spike that faded once it was obvious supply itself was intact. History tells us that fear driven oil spikes tend to be short lived. Supply disruptions that never fully materialize eventually get repriced.
The asset moves followed the same arc. Energy stocks outperformed broad indices during the price spike, then gave back much of that edge as oil fell and the trade unwound. Commodity linked funds saw strong inflows in March and April, followed by a marked slowdown, even outright outflows, as the peace framework gained traction. Bond markets in oil exporting economies tightened on the way up and loosened on the way down, mirroring the shift in revenue expectations, while importing economies saw the opposite pattern in growth and inflation forecasts.
Of course, nobody can promise the Iran ceasefire holds, and flare ups, including tanker incidents in July, are a reminder that geopolitical risk in that region doesn't vanish because a memorandum gets signed. But the broader lesson isn't really about Iran. It's about what happens to prices when fear of disruption outruns the disruption itself. History suggests that gap tends to close, and this year it closed in a matter of months rather than years.

Access our comprehensive, unbiased financial guides here.
.webp)
.webp)

.webp)
.webp)
.png)
.png)
.png)




.png)
%20(1).webp)
.webp)

.webp)