X
CLient Portal

Something unusual is happening across global markets right now, and it deserves a closer look. Stock investors appear to be partying, bond investors appear to be bracing, and central banks in the three largest developed economies are each doing something different. How can all three things be true at once, and what does it actually mean for the road ahead?
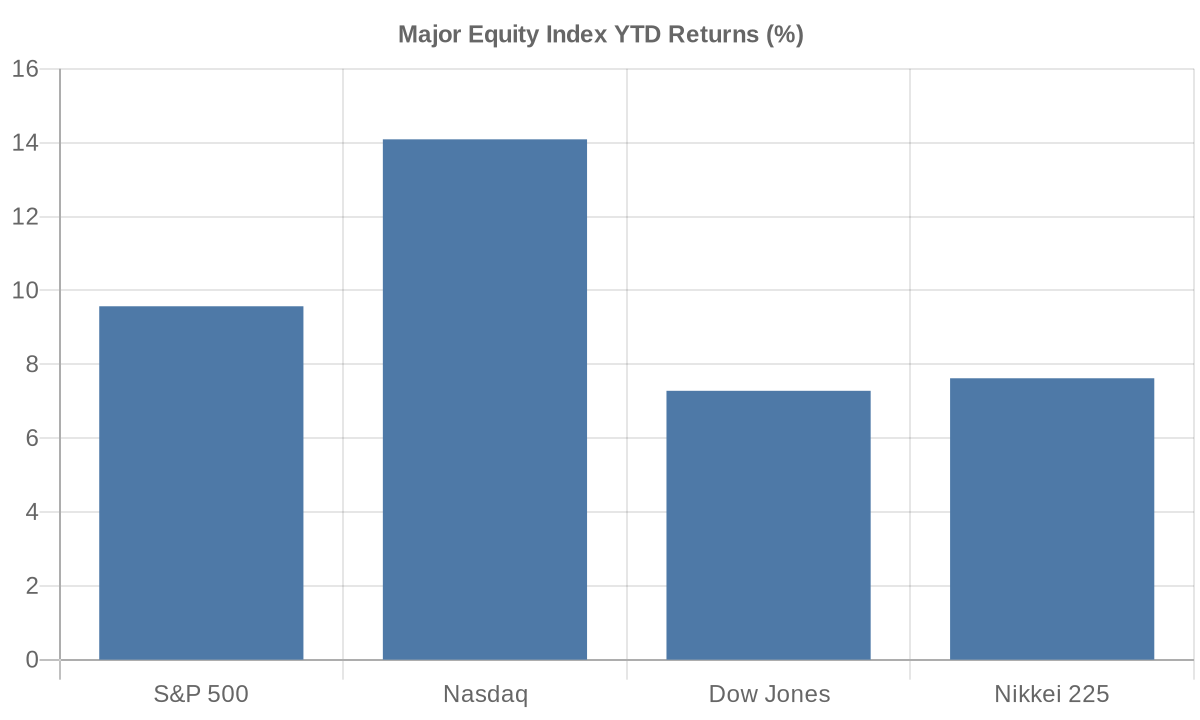
YTD equity index returns as of mid-June 2026; source: T. Rowe Price Global Markets Weekly Update.
Start with the equities picture, because it is striking. As of late June 2026, the S&P 500 stood near 7,357, up roughly 9.6% for the year, while the Nasdaq had climbed more than 14% year to date. Japan's Nikkei 225 gained over 7.6% in a single week, extending record highs. Even European stocks have participated, though with considerably less enthusiasm, trailing their American counterparts by a wide margin over the past year (26.4% for the S&P 500 versus 16.9% for the STOXX Europe 600, according to data compiled by Curvo). Volatility, as measured by the VIX, has hovered around 16, which is about as calm as markets get. On the surface, this looks like a story of resilience and confidence.
But then you look at the bond market, and the picture shifts considerably. The U.S. 10-year Treasury yield sits near 4.40%, and the 30-year yield, which was below 2% as recently as 2020, has been trading above 4% for some time now, near multi-decade highs. More telling than the absolute level is the shape of the curve: short-term rates remain above long-term rates (what bond analysts call an inverted yield curve, meaning shorter-dated Treasuries pay more than longer-dated ones), a condition that has persisted for much of 2023 through 2025. Historically, prolonged inversions of this kind have preceded every U.S. recession since the 1960s. The curve is not infallible, but it is not something to wave away either.
Of course, knowing that the curve is inverted does not tell you when or whether a recession actually arrives. In 1994, the Fed unexpectedly hiked its funds rate from 3% to 6% in roughly a year, triggering a brutal sell-off in long-duration bonds and significant losses for leveraged fixed-income investors. Yet the U.S. economy avoided an immediate recession. The bond market screamed pain; the economy muddled through. The lesson was not that bond signals are worthless, but that the timing between signal and outcome can stretch far longer than anyone expects.
So what is the Federal Reserve actually doing, and what is it saying about where it plans to go? The Fed has held its target rate steady at 3.50% to 3.75% for two consecutive meetings. That sounds like a pause, but the internal guidance has tilted in a notably hawkish direction. According to T. Rowe Price's analysis of the latest meeting, the median Fed official now projects modest additional tightening by year-end, a meaningful shift from the March dot plot (the Fed's published projection grid, in which each official marks their expected rate path), which had pointed toward cuts. Of the 18 officials on the committee, 9 penciled in at least one additional rate increase in 2026, while only 1 projected a cut.
What is driving that shift? Inflation, which appeared to be behaving itself through early 2025, has grown stubborn again. Headline PCE (the personal consumption expenditures price index, the Fed's preferred inflation gauge) came down from 2.6% at the end of 2024 to 2.1% by April 2025, which was genuine, measurable progress. Core PCE (stripping out food and energy) followed a similar path, easing from 2.9% to 2.5% over the same stretch. But since then, the re-acceleration has been notable. The three-month annualized pace of core PCE rose from 2.4% in late 2025 to 4.4% by March 2026, according to PIMCO's inflation analysis, and the year-over-year core PCE reading for May 2026 registered 3.4%, the highest since October 2023. The Fed's own updated projections now show headline PCE at 3.6% in 2026 and core at 3.3%, both well above the 2% target.
Interestingly, even the way inflation is being measured has become a source of debate. The historical relationship between the CPI and PCE inflation gauges has flipped: where CPI used to run roughly 30 to 40 basis points above PCE, it now runs roughly 60 basis points below it, one of the largest divergences since 1985. PIMCO attributes this partly to higher PCE weights on technology-related services, where AI-driven demand and tariff effects have pushed prices up. The point here is that understanding what inflation is actually doing requires getting into the weeds of how it is measured, not just reading the headlines.
Now compare the Fed's predicament to what is happening in Europe and Japan, because the differences are significant. The European Central Bank has already been easing: its deposit facility rate currently sits at 2.00%, and forecasters broadly expect euro area headline inflation to come in around 1.7% toward the end of 2026, potentially undershooting the ECB's own 2% target. The ECB's dilemma is roughly the opposite of the Fed's, managing the risk that it tightens too little rather than too much.
Japan's situation is different again. The Bank of Japan raised its short-term policy rate to 1.0% at its June 2026 meeting, in a 7-to-1 vote, reaching the highest level since September 1995. This represents a genuine and deliberate normalization after decades of unconventional policy: the BoJ was still charging negative rates as recently as January 2024. Japan's 10-year government bond yield, which was effectively capped near zero just a few years ago, has risen to around 2.62%. The BoJ is not aggressively tightening so much as carefully removing extraordinary accommodation, with inflation still running above 2% but expected to drift back below target before returning to it in 2027.
Three major central banks, three very different trajectories. That divergence matters for portfolios in ways that go beyond any single market call.
Then there is oil. The Middle East has delivered a series of escalation-and-partial-de-escalation episodes over the past year, and crude prices have swung accordingly. During one sharp escalation, Brent crude jumped roughly $10 per barrel in risk premium, rising from about $72 to briefly above $78 within 48 hours. More recently, on June 5, 2026, as hopes for a U.S.-Iran peace agreement circulated, Reuters reported Brent trading around $94 per barrel, down nearly 1% on the day following a session in which it had already dropped almost 3%. But then, almost immediately, skepticism about whether any deal would hold sent Brent futures surging back past $104 in intraday trading. The EIA's current baseline projects Brent near $106 in mid-2026, drifting down toward $89 by late 2026 and $79 in 2027 as Middle East supply gradually normalizes.
This is not 2022. Oil is no longer the dominant inflation driver it was when energy prices alone accounted for the majority of the CPI surge. But crude at $94 to $106 is not nothing, either. Historically, oil price spikes that are sustained tend to filter into transportation, manufacturing, and services costs over time. The 2014-2015 collapse, when Brent fell from above $100 to below $50 as U.S. shale surged and OPEC held its output steady, delivered a powerful disinflationary impulse globally and gave central banks room to remain accommodative. The current environment offers no such clean relief valve.
All of which brings us back to that original tension: equities celebrating, bonds worrying. Which market is right?
History suggests the honest answer is that both can be right for a while, and for different reasons. In 2018, the Fed raised rates four times, pushing the funds rate from 1.5% to 2.5% while simultaneously shrinking its balance sheet. Equities held up through most of the year before a near-20% drawdown in the fourth quarter forced a Fed rethink and an eventual pivot back toward cuts in 2019. The bond market had been signaling late-cycle stress for months before equities priced it in.
What the current data imply is not a single outcome but a range of plausible paths. In one, the re-acceleration in core PCE proves temporary, the Fed's higher-for-longer stance gradually squeezes inflation back below 3%, and long-duration bonds, which now offer yields that would have seemed extraordinary five years ago, begin contributing meaningfully to total return again. In another, sticky services and technology-driven inflation forces the Fed to tighten further, long rates push higher still, and the yield curve's recession warning eventually gets its reckoning. In a third, growth softens before inflation does, forcing the Fed into an uncomfortable choice between its dual mandates.
None of those paths is knowable in advance. What is knowable is this: diversified portfolios that hold both equities and bonds across multiple geographies are better positioned to absorb whichever path materializes than portfolios that have bet heavily on one scenario. The yield curve has been warning of elevated growth risk for two years now, and the economy has not yet rolled over. But two years of a false alarm is not the same as no alarm. Patience, not certainty, is what the moment calls for.

Access our comprehensive, unbiased financial guides here.
.webp)
.webp)

.webp)
.webp)
.png)
.png)
.png)


.png)

%20(1).webp)
.webp)

.webp)